It all sounds so simple: “Put your money in a broadly diversified stock ETF, leave it there untouched for at least ten years, invest regularly in addition via a savings plan, and wham, you’ve got a good average return in the end! But in practice, a lot of things can fail because of the word “average”.
The reason: The stock market does not run as straight as the interest rates from the calculable mathematics, but tends at times to over- and understatement, which makes the returns sometimes run with a large gap to the average curve. Sometimes there is significantly more than the average return, but sometimes there is significantly less. Especially in these times it can be difficult to stay on the soon-to-be and stick to your original plan. Those who sell in such situations realize losses or give away valuable returns when deposits are paused – and this despite the fact that they may actually have marked the average annual return in the years before.
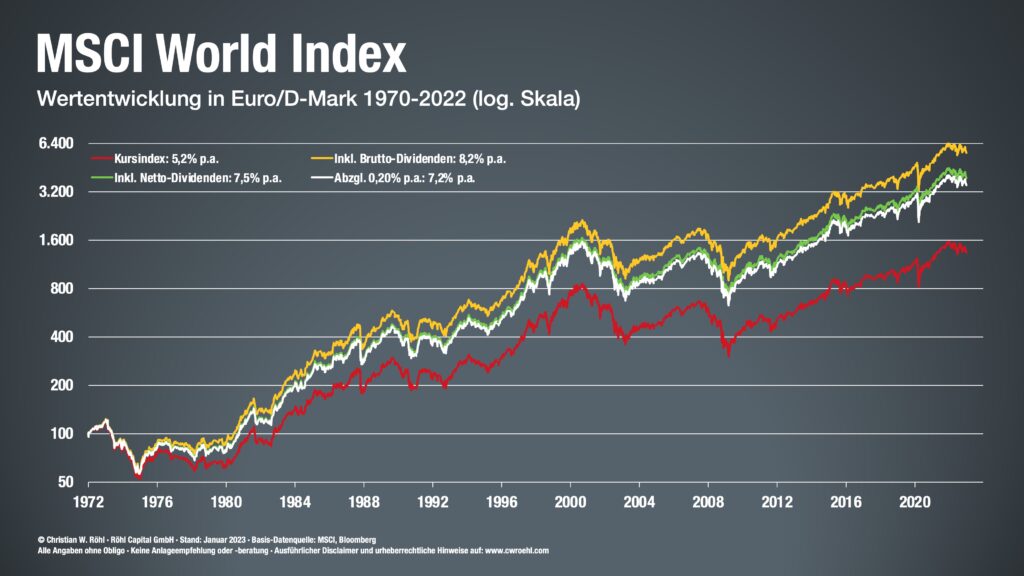
The MSCI World has a long history
The MSCI World is an index with one of the longest histories. It shows that the price index has increased almost fifteenfold since the beginning of 1970 and has generated an average return of 5.2% per year over the 53 years. With dividends reinvested, it is even a fifty-fold increase, and thus 8.2% average annual return. That sounds very tempting, but the index has also had significantly worse years at times.
For example, in the period from September 2000 to March 2003, when the dotcom bubble burst, causing losses of over 50% at times. Or the global financial crisis from 2007 to 2009, the Iraq crisis together with the US recession from September 1990, and the legendary stock market crash of 1987, when the markets fell by almost 30% within a very short period of time. On the positive side, the period between October 1990 and August 2000 was one of the longest bull markets.
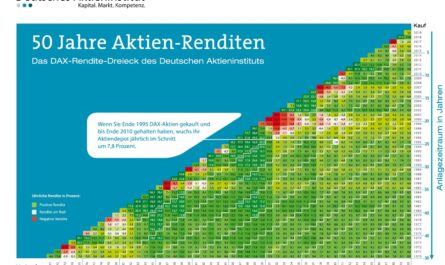
However, Christian W. Röhl’s return triangle also shows here: If you had an investment horizon of 15 years, there was no time in the last half century, regardless of the entry and exit point, during which you would have ended up with losses from the markets. Who would have invested even additionally by savings plan further, which could have thinned out the white spots further and brightened the dark ones somewhat and would have moved finally closer to the ideal line. The fluctuations can therefore be smoothed out further by means of savings plans.
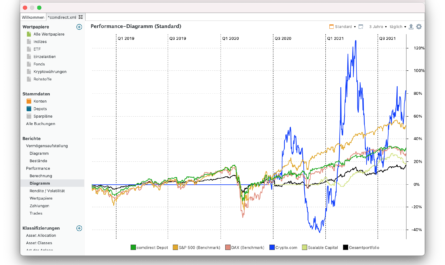
As a rule, one can assume that such an ETF portfolio moves on average by about 1.5% per month, but there are also significantly higher deviations. With a depot value of 10,000 euros, a loss of 1% with 100 euros may still be bearable and a drop of 10%, or 1,000 euros, may still be tolerable, but over time, with the same fluctuation range, the figures become higher and higher in absolute terms. With a depot volume of 50,000 euro it is already 500 and 5,000 euro, with 250,000 euro already 2,500 and 25,000 euro.
| Deposit volume | – 10 % loss | – 1 % loss | + 1 % gain | + 10 % gain |
|---|---|---|---|---|
| 10.000 Euro | – 1.000 Euro | – 100 Euro | + 100 Euro | + 1.000 Euro |
| 50.000 Euro | – 5.000 Euro | – 500 Euro | + 500 Euro | + 5.000 Euro |
| 100.000 Euro | – 10.000 Euro | – 1.000 Euro | + 1.000 Euro | + 10.000 Euro |
| 250.000 Euro | – 25.000 Euro | – 2.500 Euro | + 2.500 Euro | + 25.000 Euro |
| 500.000 Euro | – 50.000 Euro | – 5.000 Euro | + 5.000 Euro | + 50.000 Euro |
From half a savings rate to a year’s salary
In concrete terms, you can say that with a small 10,000-euro deposit, the normal ups and downs amount to somewhere around half a monthly savings installment and are thus quickly recouped. With 100,000 euros, this fastball can quickly amount to an entire month’s salary. With a quarter of a million it looks even completely different. Then we are no longer talking about a monthly net, but about an annual salary, by which the value of the deposit can fluctuate within a month.
However, if you build up your portfolio step by step and earn such sums over the years, you will inevitably get used to the ever higher amounts and have trained them. Who inherited the money, however, or won the lottery, it will be emotionally much more difficult.
Conclusion: Although the average returns of broadly diversified ETFs always sound quite tempting, from an emotional point of view they are not always so easy to endure in practice in the event of stronger fluctuations. A smooth yield curve can only be found in overnight deposit accounts – but then without any real return and long-term loss of purchasing power. That is definitely not a good deal.
Keyfacts
- the price of an index never runs ideally to the yield curve
- over- and under-performances cause it to deviate significantly from it
- these fluctuations always have to be endured
- setbacks are sometimes over 50% are possible
- these can be smoothed by long-term and savings plans