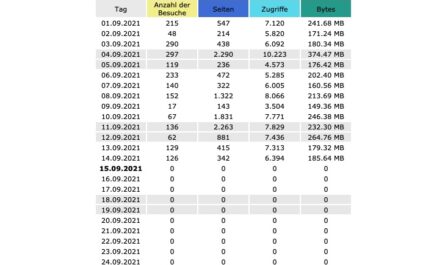
A solid plan for long-term wealth accumulation requires not only wise investment decisions in the form of stock or ETF savings plans, but also staying power and, above all, continuous motivation to always stay on the ball. A dividend calendar can serve as an extremely motivating tool, allowing investors to track their regular distributions. Not only can they compare the amount of their recent inflows with the past ones and thus log the steady growth, but on top of that they learn when and in what amount the next payments will be made.
One such dividend calendar, which we have been using for about two years, is the one from DivvyDiary. The practical thing about it is that the tool can be linked directly to Portfolio Performance, in which we regularly enter the broker statements from our savings plans, one-off purchases and also dividend and interest payments. Via an interface, these can be transferred directly to DivvyDiary with just one click, which means that the tool is always provided with the latest portfolio data without any additional maintenance effort.
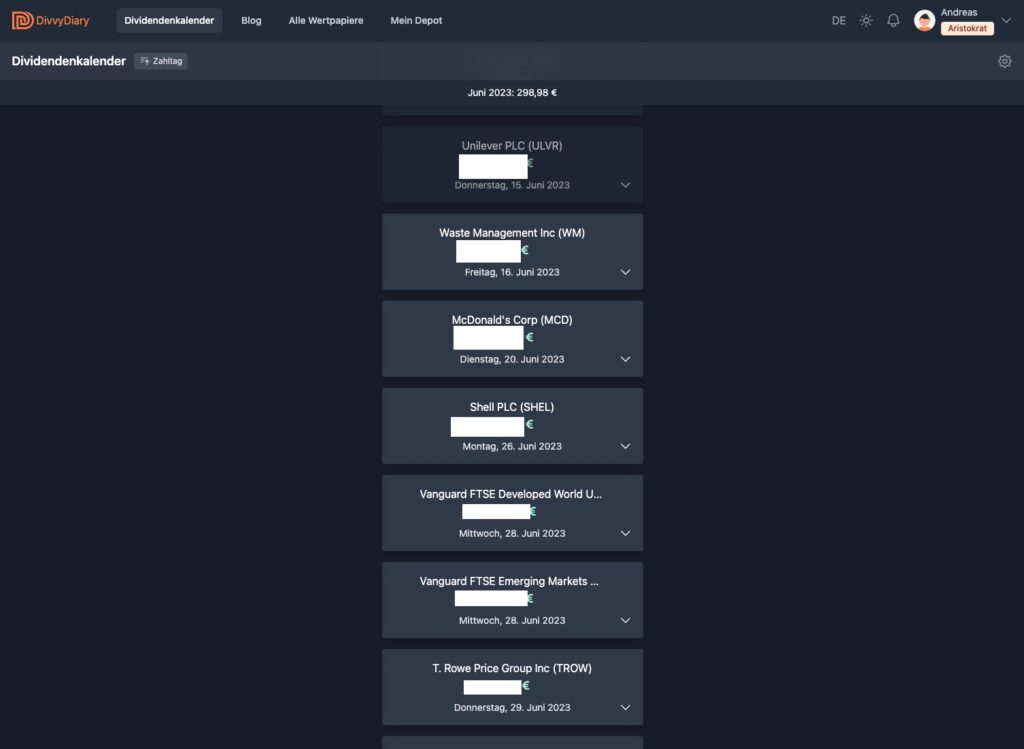
Based on the fractions in the portfolio, the later distribution can be displayed in absolute figures. DivvyDiary does not only show the payday, but also lists the ex-day, which is the date you have to have the shares in your portfolio for the payout.
Extensive database and statistics
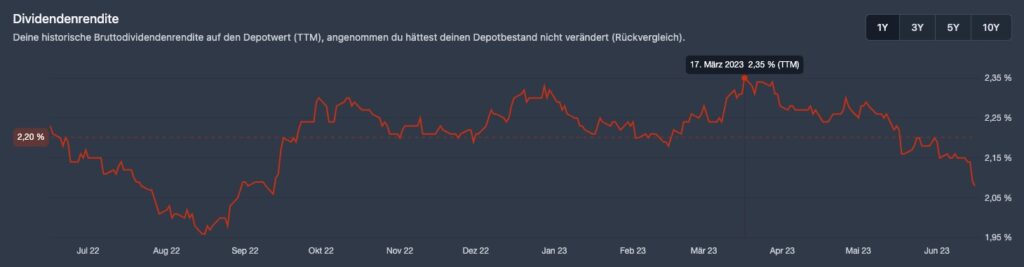
The core of DivvyDiary is an extensive database with historical information on individual stocks and ETFs, which can be clearly displayed using history graphs. This way, you always have an overview of possible reductions and increases.
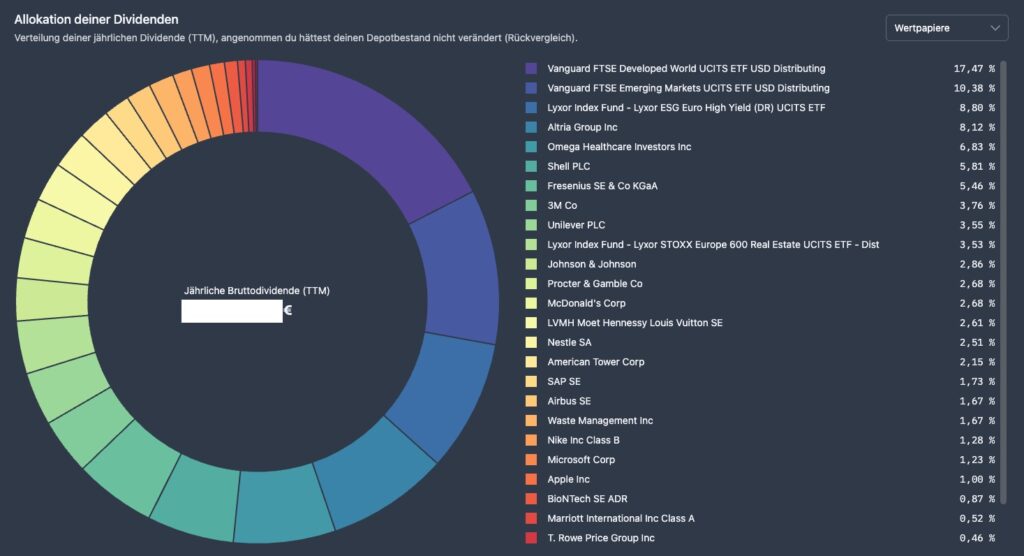
For the own depots DivvyDiary informs about upcoming payments, shows the actual own dividend yield on the depot value and gives an outlook on the coming months via the annual gross dividends. Via the dividend matrix this even works broken down for each individual stock. Apart from that DivvyDiary offers some analysis functions. Thus, the stocks can be clearly displayed with the help of pie charts based on sectors, countries or currency areas.
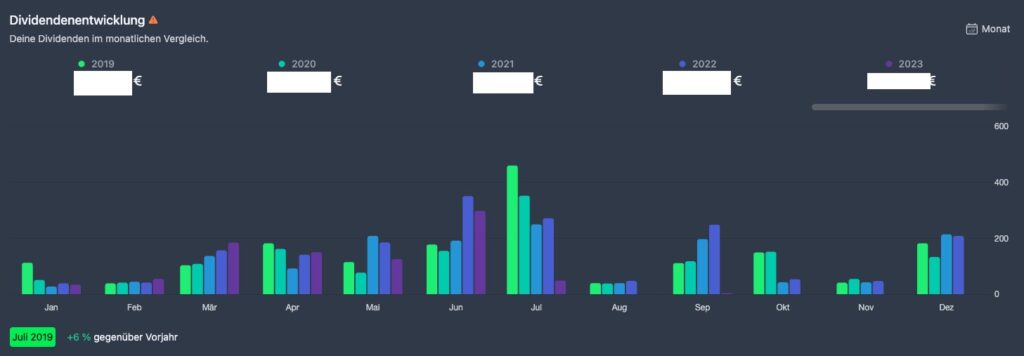
Also the growth of one’s own gross income from dividends can be displayed over the last years with any change. Even a community function is not missing, which can be used to get inspiration for possible acquisitions – some securities can be discovered in the database.
In the basic version DivvyDiary is completely free to use. Who would like to have the extended statistics and diagrams from the aristocrat plan and support the project financially, pays monthly 5,99 euro, and/or 64,99 euro in the year for the Upgrade. The Aristocrats plan can be tested free of charge for seven days.

- Heussinger, Werner H. (Author)
Letzte Aktualisierung am 2024-07-26 at 15:13 / Affiliate Links / Bilder von der Amazon Product Advertising API