After numerous media outlets have questioned the classic ETF strategy in recent weeks, in some cases with very lurid headlines, and thus caused uncertainty mainly among inexperienced investors by criticizing the composition or unfortunately completely losing sight of the long-term nature, we now want to encourage the opposite, i.e. the motivation to continue or even set up a new savings plan.
The Zendepot team has developed the right calculators for this and made them available free of charge on its website. The financial blog was originally founded by Dr. Holger Grethe in early 2013 and quickly developed into one of the largest contact points for passive investing with ETFs. After the founder retired around two years ago, Alexander Baetz, Martin Gschwentner and Janis von Bleichert took over the helm and have since continued the project with their own blog articles, YouTube videos and other offerings. They also propagate long-term and broadly diversified investment in the financial markets, which is also completely self-directed. The ETF calculators were born out of this idea.
Lots of exciting statistics and charts
The heart of the offer is the ETF savings plan calculator. The trio wants to use it to show that an ETF savings plan can create a large fortune for old age, even with supposedly small sums. The calculator uses four parameters to illustrate the assets that can be created, but can also take historical values of different ETFs into account and thus even realistically incorporate the past. All you have to do is define a possible one-off investment, specify the monthly savings rate and determine your desired investment period and the expected performance per year. The calculator then provides a clear overview of the increase in value and the expected assets. With advanced calculations, even fees and taxes can be taken into account.
If you start from scratch today, but are prepared to invest 100 euros per month over 30 years, you could end up with almost 70,000 euros if you make the conservative assumption of an average annual return of 4%, with just under half of this amount having been paid in. If the savings rate is doubled, more than 137,500 euros can even be achieved.
Historical data and composition
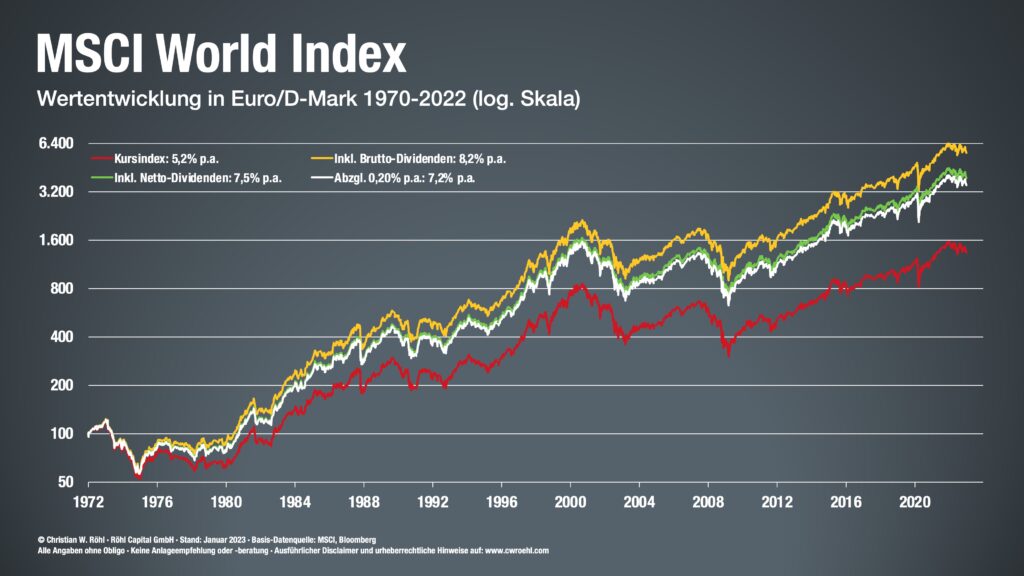
If you select the historical calculation, you can even include your previous deposits in the statistics or find out how the investment would have developed if you had already invested in the past. Not only can any period of time be considered, but also various indices. Although the MSCI World is preset, other index types such as the FTSE All Word, the MSCI Emerging Markets, the Euro Stoxx 50, the MDAX or the Nikkei can also be selected. Theoretically, any ETF can be used for comparison by entering the ISIN. The data can then be graphically processed and exported in a return triangle.
The huge database also makes it possible to make a comprehensive comparison between the individual ETF favorites, whereby the composition can be clearly displayed according to sectors, countries, individual positions and even some key return figures. The calculators not only provide a wide range of statistics, but are also ideal for research.
It is definitely worth taking a look at the Zendepot website. In addition to the ETF calculators, there is extensive basic knowledge about ETFs as well as numerous current articles on a wide range of topics from the world of finance.