If an ETF strategy is too boring for you, and if you have a keen interest in the global economy and entrepreneurship anyway, you are likely to invest in individual stocks sooner or later. However, one should not simply invest blindly in any company whose name one has heard before, but proceed with a plan.
Of course, a diversification in the sense of a broad diversification is a mandatory prerequisite and also the business model of each company should be understood in order to be able to evaluate possible future prospects. But there are numerous other selection criteria that can make the decision easier in stock trading.
We present the most important stock ratios from fundamental analysis*, which are predominantly based on meaningful company ratios, such as earnings, sales and cash flow.
The dividend yield
One of the most popular strategies among investors in individual stocks is the dividend strategy. Here, investors promise themselves additional income through the distribution of their companies, without having to sell off individual positions in retirement. The dividend yield shows how much a company pays out to its shareholders in relation to its share price.
The higher this ratio turns out to be, the faster you can get out your initial investment in the company with dividends only and thus achieve your personal return of investment (ROI), which minimizes your own risk with each dividend payment. Depending on the purchase price, the personal dividend yield can change constantly. If you have purchased a stock at a lower price than the current price, you will have a higher dividend yield. If, on the other hand, the share price is higher, your own dividend yield may decrease.
But be careful: the dividend yield increases not only when a company makes larger distributions, but also when the share price has fallen more sharply. If this is the case, there is usually a reason why investors are increasingly dumping their shares. Perhaps the company is embroiled in a scandal or has had to post a whopping drop in sales and profits? Relying solely on the dividend yield is therefore not the right approach.
The dividend yield is calculated as follows:
(dividend per share / share price) x 100 = dividend yield in percent.
Example: A company pays a dividend of 2 US dollars per share certificate and is traded on the stock exchange at a price of 220 US dollars. The dividend yield is therefore approximately 0.9% ((2 / 220)*100).
The price-earnings ratio (P/E ratio)
The price-earnings ratio is probably one of the best-known share ratios. It compares the stock market price with the profit and indicates how many years a company would need to reach the current stock market value with constant profits. The lower the P/E ratio, the faster the invested capital would be earned by the company.
The ratio helps determine whether a stock is low or highly valued. A high P/E ratio can mean that a stock is in high demand and therefore possibly overvalued. However, it can also mean strong sales or earnings growth. A low P/E ratio, on the other hand, means that the stock has a rather low stock market valuation in relation to the company profit generated. But it also means poor earnings prospects. The price-earnings ratio is therefore not particularly meaningful on its own.
The price-earnings ratio is calculated as follows:
Share price / company earnings per share = P/E ratio in years.
Example: The share price of a company currently stands at 220 US dollars, and the earnings per share in the previous year were 25 US dollars. The P/E ratio is therefore 8.8 years (220 / 25).
The price-to-sales ratio (P/S ratio)
The price-to-sales ratio, on the other hand, compares the current stock market price of a share with its sales and indicates how many years a company would need to reach its current stock market value if sales remained constant. The lower the KUV, the faster the invested capital would be recovered by the company. This ratio also makes it possible to determine whether a company is undervalued or overvalued, but it is not quite as meaningful as the P/E ratio, as profitability is ignored here.
The price/sales ratio is calculated as follows:
Share price / company sales per share = P/E ratio in years.
Example: The share price of a company currently stands at 220 US dollars, and sales last year amounted to 100 US dollars per share. The KUV is therefore 2.2 years (220 / 100).
The equity ratio (EKQ)
The equity ratio is mainly used for risk assessment in fundamental analysis. It is an indicator of how financially strong a stock corporation is. The higher the equity ratio, the better the company can finance itself from its own resources and is less dependent on borrowed capital. The debt burden is lower.
It describes the creditworthiness of a company and indicates the probability of insolvency. Depending on the industry, the equity ratio can vary greatly. But the age of a company also plays a major role.
The equity ratio is calculated as follows:
( equity / total capital ) x 100 = EKQ in percent.
Example: A company holds $1,000,000 in equity, and the total capital is $2,500,00. The company therefore has an equity ratio of 40% ((1,000,000 / 2,500,000) x 100).
The price-to-book ratio (P/B ratio)
The price-to-book ratio (P/B ratio) indicates the ratio of a company’s equity to its market capitalization on the stock exchange. If the ratio is greater than 1, the company is overvalued in relation to its equity; if, on the other hand, the P/B ratio is less than 1.0, it can be assumed that the company is undervalued. Here, too, the figures are difficult to compare with each other, depending on the sector.
The price/book ratio is calculated as follows:
Share price / Book value per share = P/B ratio.
Example: The value of a share is 200 US dollars, the price of the share is currently 220 US dollars. The P/B ratio is therefore 1.1 (220 / 200).
The price/cash flow ratio (KCV)
The price/cash flow ratio is a liquidity-oriented ratio in fundamental analysis. It relates the share price to the cash flow of a company and indicates how each liquid US dollar is valued on the stock exchange. Cash flow marks the balance of income and expenses during a complete fiscal year and thus indicates the liquidity of a company.
The price/cash flow ratio is calculated as follows:
Share price / cash flow per share = KCV.
Example: A company costs 220 US dollars on the stock exchange. The cash flow per share is 30 US dollars. The KCV is therefore 7.33. (220 / 8).
Conclusion
There are quite a few key figures for the valuation of shares. Most of them seem to be consistent, but are not really meaningful on their own. Just because a stock has a low P/E ratio, it does not mean that the security is actually worth buying. Perhaps the price has simply fallen in recent weeks because the business outlook has worsened and shareholders have sold their positions as a result?
When investing in individual stocks, one must always keep an eye on the big picture. Only those who do their homework properly and spend a lot of time on their investments can profit in the long term. Stocks are not a get-rich-quick method without effort.
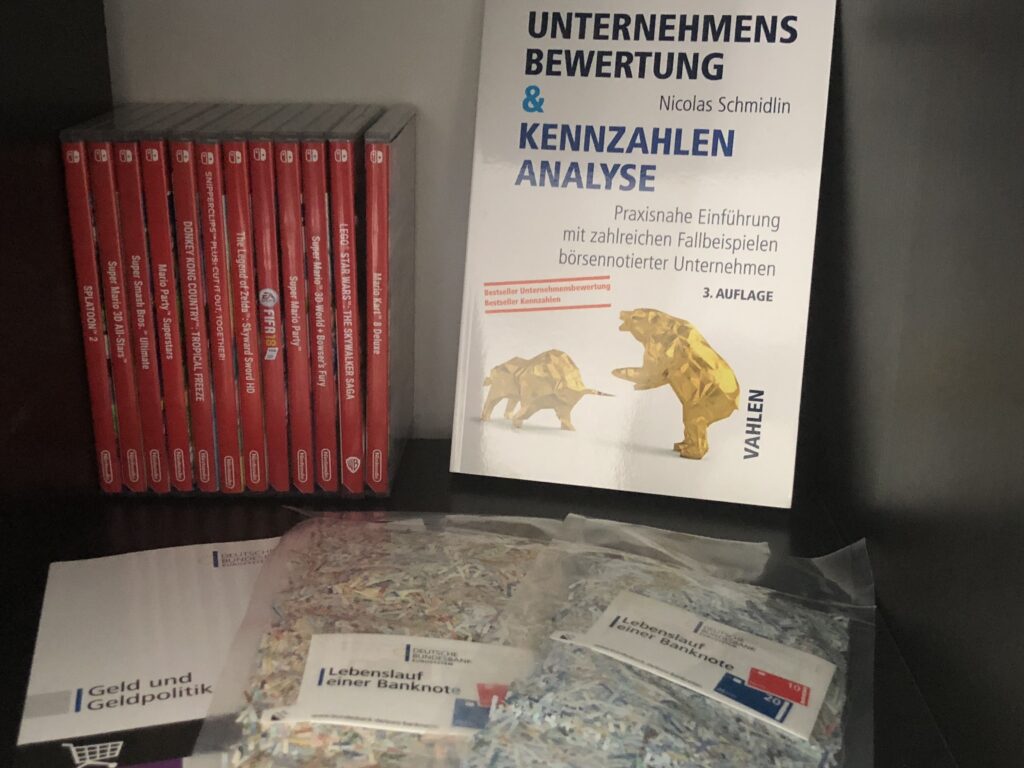
If you want to delve deeper into fundamental analysis, we recommend the book “Unternehmensbewertung & Kennzahlenanalyse: Praxisnahe Einführung mit zahlreichen Fallbeispielen börsennotierter Unternehmen” by Nicolas Schmidlin*.

Letzte Aktualisierung am 2024-07-24 at 00:44 / Affiliate Links / Bilder von der Amazon Product Advertising API