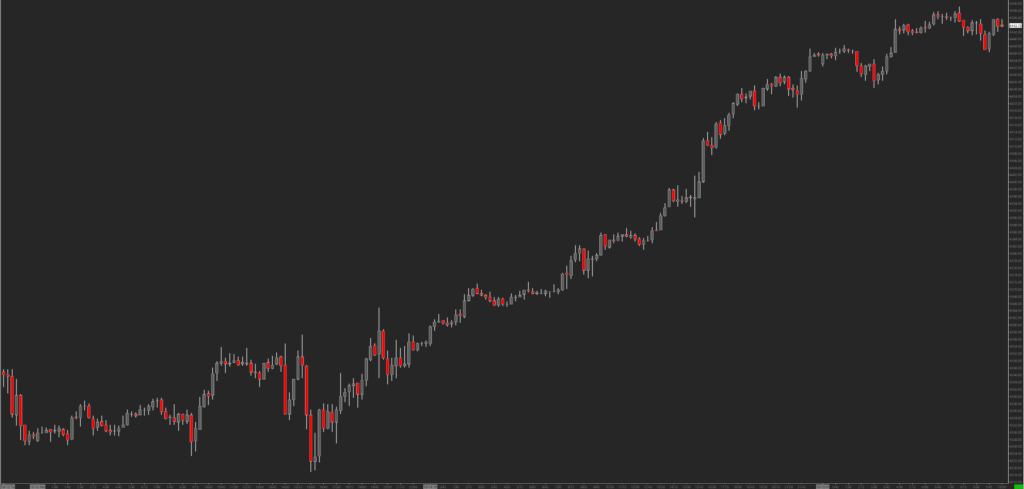
There are many different ways to display the price of a stock, a futures or a commodity. Probably the best known representation is the line chart, where the price trend over a certain time is displayed graphically on the x-axis. However, one cannot really extract much information apart from how high the price of the asset was at a certain point in time. The candlestick chart, which is especially popular among traders, offers much more analysis possibilities. We at TradingForFuture.com also use it every day.
The candlestick chart was originally developed by rice traders in Japan and has been used since the 17th century. Its representation allows a deeper look into the market and makes it possible, among other things, to identify different patterns. Such a chart is more descriptive without being complicated.
First of all, each candle represents a certain time period, which can be set by the user as desired, depending on the charting program. The most common ones are probably the daily, hourly and 15-minute charts. Then each of these candles represents a unit of the set time period. In a daily chart, a single candle thus represents a whole day, or it takes a day for a candle to be formed.
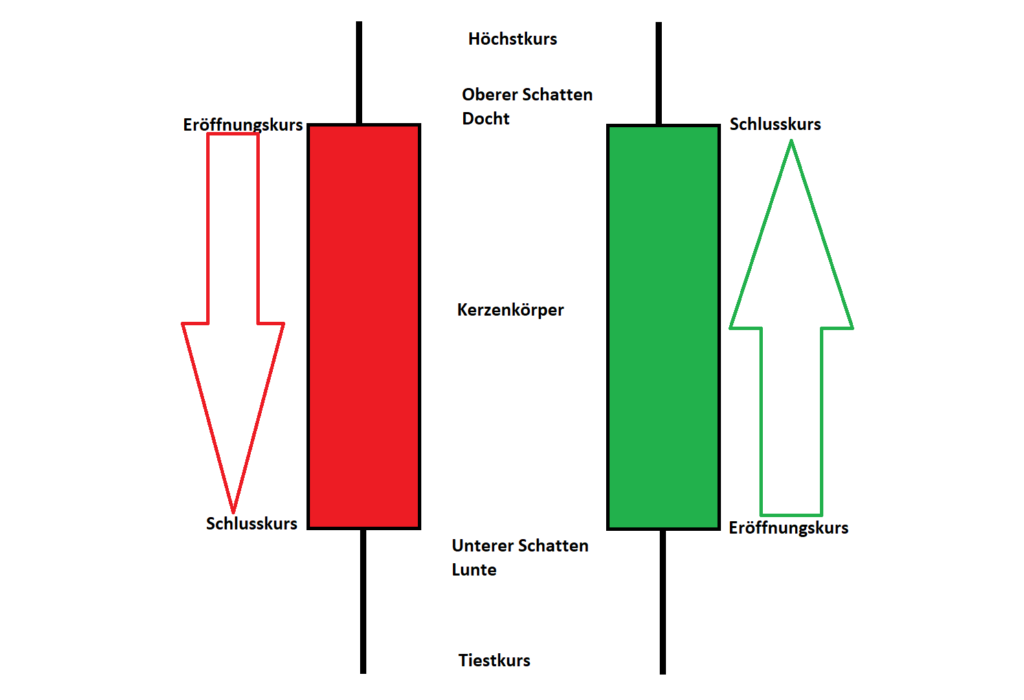
Structure of a candle
Each candle consists of a candle body as well as a wick and a fuse. The candle body is the area where the price of the mapped asset has stayed between the opening and closing price and thus has spent most of its time there. Fuses and wicks, on the other hand, are formed when the price initially went in one direction after the opening, but then reversed and started its way in the other direction. The color of the candles indicates whether the price trend within the period was positive or negative. As a rule, down candles are displayed in red and up candles in green.
Certain candles allow interesting conclusions to be drawn
The larger the candle, the stronger was the price movement within the period. The larger the fuses and wicks, the higher the volatility probably was, as there was a lot of fast trading. If a candle has a very small candle body and actually consists only of opening and closing price, then the price hardly changed during this period. This is called a doji. Such candles often occur in sideways phases, when the market cannot decide on a trend direction. However, such a candle can also indicate that the previous dominance of buyers or sellers is decreasing, an equilibrium has been created and the trend can move in the opposite direction with a strong impulse. Dojis are therefore called reversal candles in the classical market technique.
This looks similar with the so-called hammer, or with a pin candle. Here the candle body is mainly in the upper or lower area of the candle, which was drawn with a long wick or a long fuse. Then during this time period, an aggressive buyer, or seller came into the market and pushed the price in the opposite direction.
For traders it is much more important that the focus of the candlestick chart is more on the price than on the time. In the candlestick chart, it is much easier to identify so-called support and resistance areas at a price level than in a classic line chart. The same applies to an upward or downward trend, where new highs and lows are broken again after a necessary setback.
You can use this information for your trading. However, it requires a lot of other information to trade profitably with it. From time to time we will go into this in more detail in this blog.
Keyfacts:
- the candlestick chart allows much more analysis functions
- it is much easier to recognize opening and closing prices as well as highs and lows
- the structure of a candle tells a story
- different patterns allow conclusions to be drawn about what has happened
- especially with traders of the market technique this form of the price representation is popular